Application for the ARC (Academic Resource Center)Visit site
Worked with school officials to double administrative efficiency by designing software to streamline tutoring scheduling/attendance for 150+ students
Architecture and design

Typescript was used as the programming language.
The top layer of the pyramid (website) provides the core user interface, while the bottom layer (spreadsheets) store the raw data.
The middle layer (Google Apps Script) is a scripting language that runs directly on the spreadsheet.
Maintainability: Using spreadsheets (Google Sheets) as opposed to a conventional database increases maintainability and reduces the risk of accidental data deletion. Furthermore, it is important for non-technical users to be able to access the raw data and edit it directly. While normally I would use a database, spreadsheets turn out to be more convenient.
Error handling: There is a communication bridge between the spreadsheet and the website that the user interacts with. If a spreadsheet operation fails, users will be notified, so that they can try again. This is an improvement over the old spreadsheets, where “silent failure” frequently occurred and students would disappear from the schedule without warning.
When a learner submits a request for a tutor…
One of the important processes the application implements is tutor-to-learner scheduling. The process begins when a learner submits a request for a tutor. The app keeps track of the necessary data and uses status trackers so the user can mark when each step is completed.

Design of user interface
- The UI consists of windows; each operation or step gets its own window. Multiple windows can be opened at once, which is advantageous for multitasking.
- The scheduling workflow consists of three steps, one window for each step.
- A hyperlink system allows the user to jump from overview to detail view, click on a student to see detailed info about him/her, etc.

Main benefits: The simple three-step scheduling workflow is easy to learn and keeps the scheduling process linear and organized. The hyperlink system gives the user quick access to information when it is needed, such as when contacting a student.
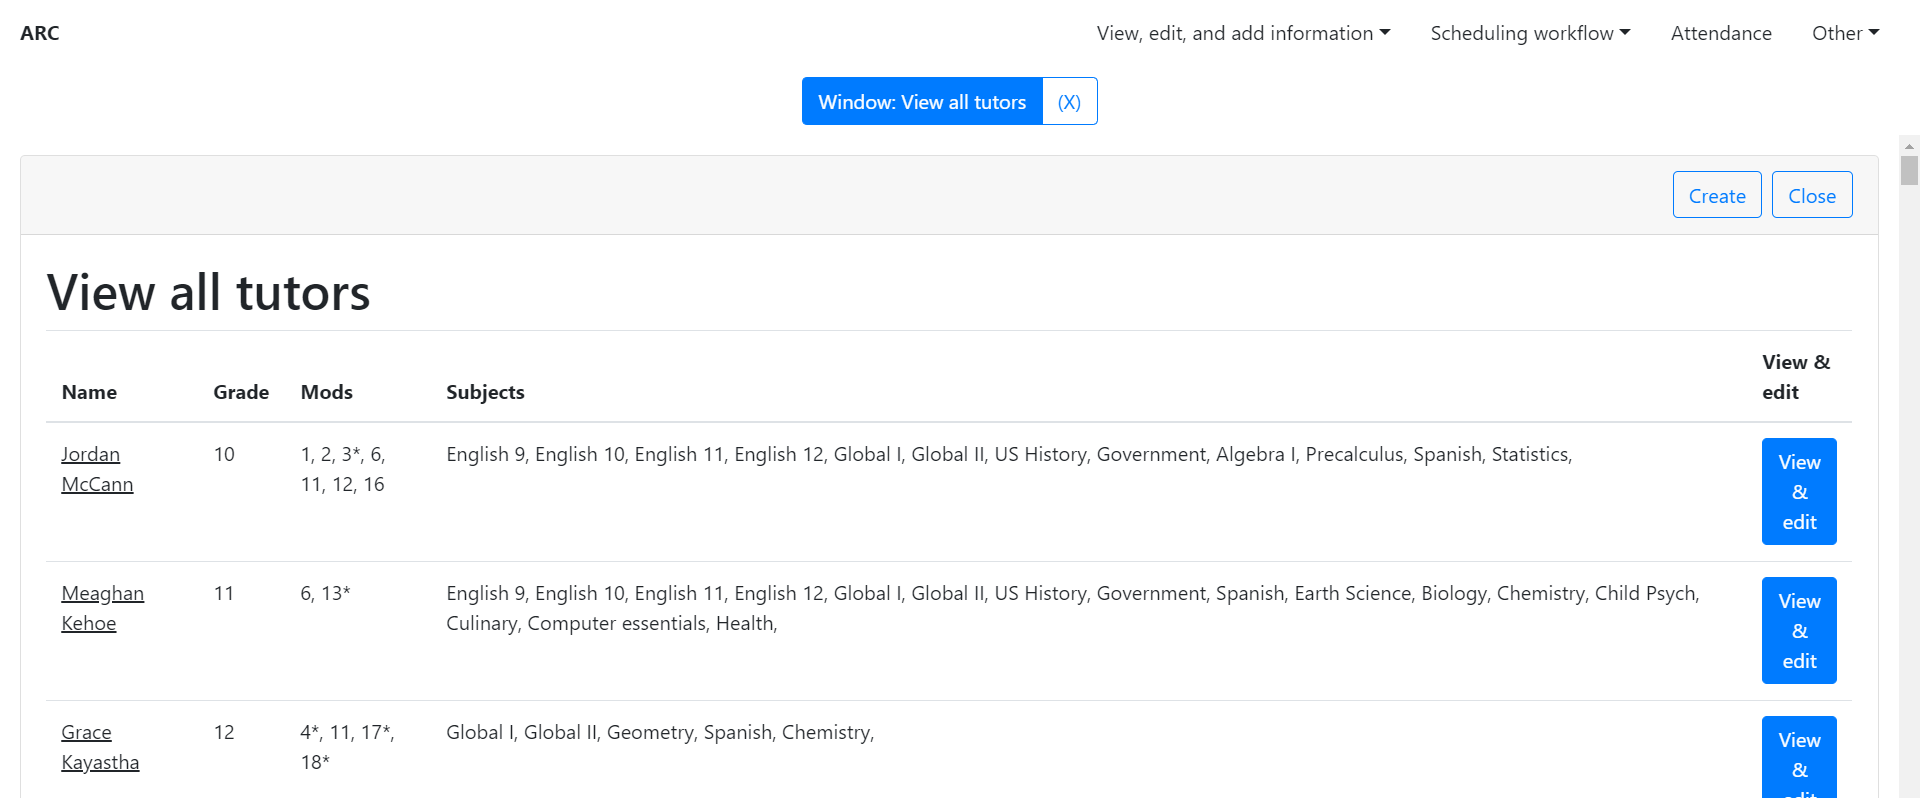
Tutor information UI
The user can see an overview of all tutors. New tutors’ information can also be added. A similar UI exists for editing learners, requests, bookings, matchings, etc.
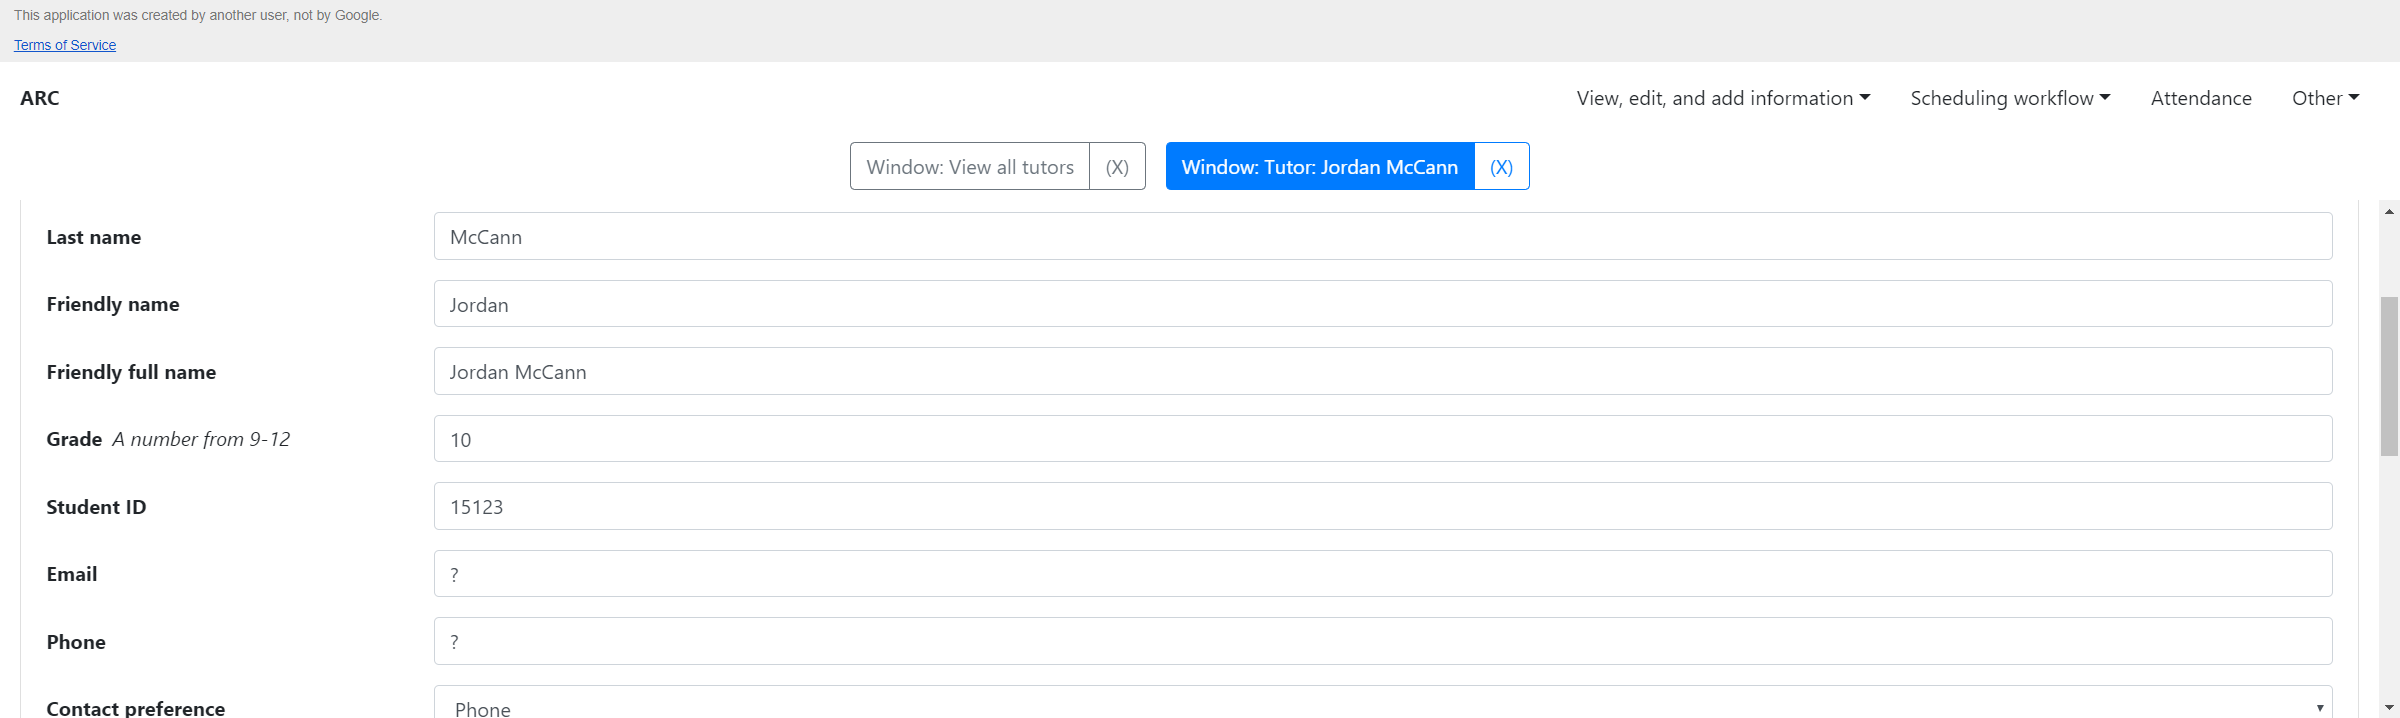
Clicking a tutor opens a new window where their information can be edited in a standard CRUD interface. The changes made in the website are propagated to the spreadsheet.
Attendance tracking UI
The attendance tracker is a simple table of all students with an expandable detail view.

Main benefits: One page has an overview of all the important attendance info. This makes it easy to spot students with low attendance levels.
Managing the data
- Bookings and tutor-learner matchings are automatically created and managed as part of the scheduling workflow.
- Every year, new tutors and learners sign up via. electronic form, and their info is added in bulk to the data spreadsheet.
The above two processes handle most of the data. The exception is attendance data, since the attendance log is filled with hundreds of entries a day and is processed in daily chunks. Attendance data is processed like this:
- Each tutor and learner submits their attendance data via. a form.
- The form data goes into a spreadsheet.
- The data is processed into an intermediate format.
- Later, the intermediate format is reprocessed and integrated into the rest of the spreadsheet (“final format”). This data goes directly to the attendance displays.

Data is processed ahead of time so it doesn’t need to be recalculated every time attendance info is retrieved.
Why four steps? The key complicating factor is that the final format needs to be compressed and optimized to make the app loads faster. While the compression could be done in a single step directly on the form data, this makes mistakes much more difficult to see. Multiple steps make the process more robust and reproducible.
Important advantages of the four-step system:
- The internals of the data processing are more transparent and easier to correct. In particular, mistakes can be quickly undone.
- There is strong backward compatibility if the form changes, because each step is separated.